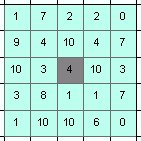
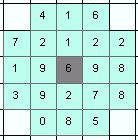
Neighborhoods (the grey cell is the cell in which the point is located):
| Square | Circle | ||
| Width = 3 | Width = 5 | Diameter = 3 | Diameter = 5 |
 |
 |
 |
 |
Inputs:
- A point feature class
- A raster dataset for which the statistics will be calculated.
- A prefix for the field names. The function adds
several fields to the point attribute table. The prefix will help
the user to calculate the statistics of several rasters for the same
points and add the results to the same attribute table. For example
the user wants to calculate statistics for the slope and elevation for
a point dataset. This requires two different rasters (Elevation and
Slope). The function needs to be run twice
- on the Elevation raster with prefix "EL"
- on the Slope raster with prefix "SL"
The result will contain fields "EL_Min", "EL_Max", "SL_Min", "SL_Max", etc.
Outputs:
- A point dataset - a copy of the original points
- All the original attributes will be preserved.
- Depending on the type of
the raster used, the following statistics will be calculated for each
point and added to the attribute table of the output (XXX in the field
names below replaces the prefix used in the function).
- Integer and Floating point rasters
- XXX_Count - the number of cells within a zone
- XXX_ZVal - the Z value of the cell in which the point is located.
- XXX_Sum - the sum of the cell values within a zone
- XXX_Min - the minimum values within a zone
- XXX_Max - the maximum value within a zone
- XXX_Range - the range of values within a zone
- XXX_Mean - the average of the values within a zone
- XXX_STD - the standard deviation of the values in a zone
- XXX_Median - the median value in a zone
- Integer rasters only
- XXX_Major - the majority value (the value that appears most times in a zone).
- XXX_Minor - the minority value (the value that appears least times in a zone).
- XXX_Var - variety (the number of unique values in a zone).
- Integer and Floating point rasters
Command line syntax
ETS_GPPointStatistics <Input Points> <Input Raster> <Out Raster> <Prefix>
Parameters
| Expression | Explanation |
|---|---|
| <Input Polygons> | A Point layer or feature class |
| <Input Raster> | A Raster dataset or Raster layer |
| <Out File Name> | A String - the full name of the output feature class. |
| <Prefix> | A String (maximum 3 characters) representing the prefix. See description above. |
Scripting syntax
ETS_GPPointStatistics (Input Points, Input Raster, Out File Name, Prefix)
See the explanations above:
<> - required parameter
{} - optional parameter
All ESRI
products mentioned are trademarks of Environmental Systems Research
Institute, Inc.
Copyright: Ianko Tchoukanski